Tell real differences from lucky numbers
Our statistical analysis checks whether the changes in your figures are real, and how sure you can be.
A few examples
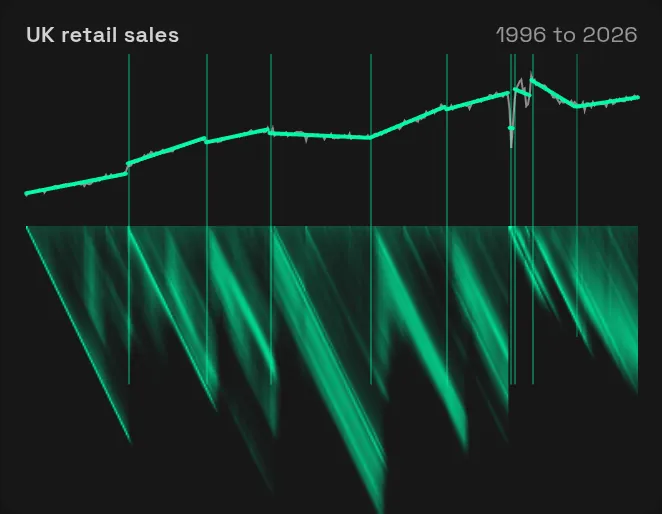
When UK retail sales changed courseChangepoint detection: spots when sales, costs or complaints genuinely shift.
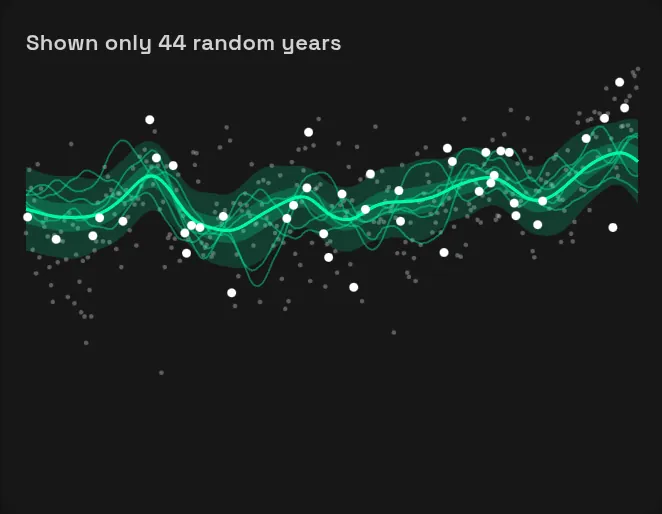
Three centuries of English temperaturesGaussian processes: a trend whose uncertainty widens where data is patchy.
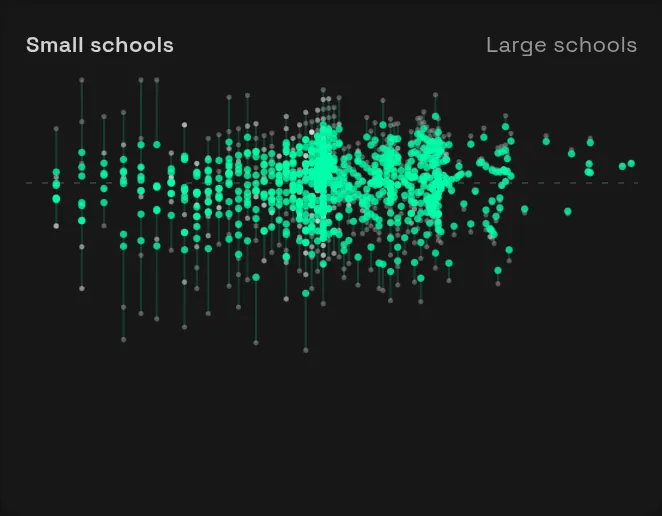
Ranking 778 schools fairlyMultilevel models: fair comparisons of sites, branches or teams of any size.
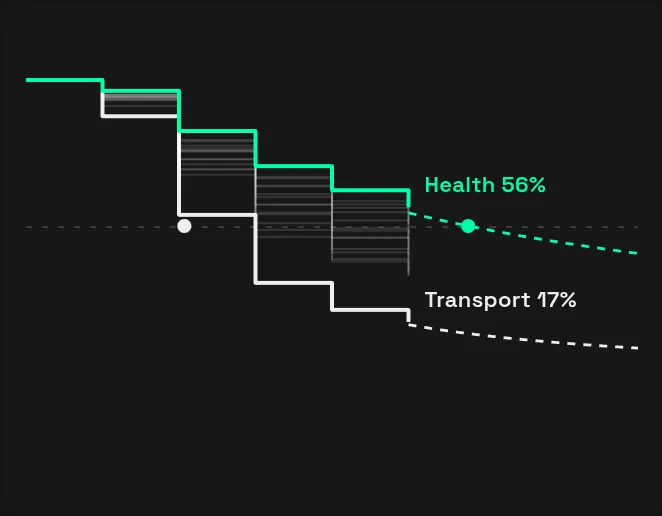
How long new UK businesses surviveSurvival analysis: how long customers, contracts or equipment last.
Questions like these
- Academy trusts Is one school’s jump in results real, or just a small year group?
- Care home groups Are falls at this home really higher, or is it a handful of bad weeks?
- Membership organisations Did the new renewal letter actually lift renewals, or would members have renewed anyway?
- Food and drink producers Is the variation between batches from the new supplier real, or within the normal spread?
- Franchise networks Which franchisees are genuinely ahead once we allow for the size of their patch?
- Insurers Are claims from this area really higher risk, or is it a few large ones?
What working with us looks like
- Start with the decision
- Tell us what you need to decide and send the records you already keep, such as spreadsheets, system exports or survey results.
- We check the data can answer it
- If it can’t, we’ll say so early and explain what would.
- Answers you can act on
- Which differences are real, which are chance, and how sure we are, written for the people making the call.
- Repeatable next time
- The analysis and a short note, so the same figures can be produced again.
You’d work with Nicola
PhD Statistics, Newcastle University · Co-Director
Nicola has a PhD in Statistics from Newcastle University, specialising in Bayesian inference and predictive analytics. She’s a former lecturer at Newcastle University, with published research on modelling change across place and time and on real-time prediction systems.
Common questions
- What data do we need?
- Usually what you already have. We’ll look at it with you first and tell you whether it can answer your question.
- What does a first piece of work look like?
- We agree at the start what the first useful result is, often a check on one real decision, so you can judge early whether it’s worth going further.
- Can you explain the results to our board?
- Yes. We write results for the people who’ll act on them, without jargon.
Got a number you’re not sure you can trust?
Tell us about it, and we’ll say whether there’s a real difference to find and how we’d check. The first conversation is free.