Distribution Drift: When Good Models Go Sideways
· KH Solve
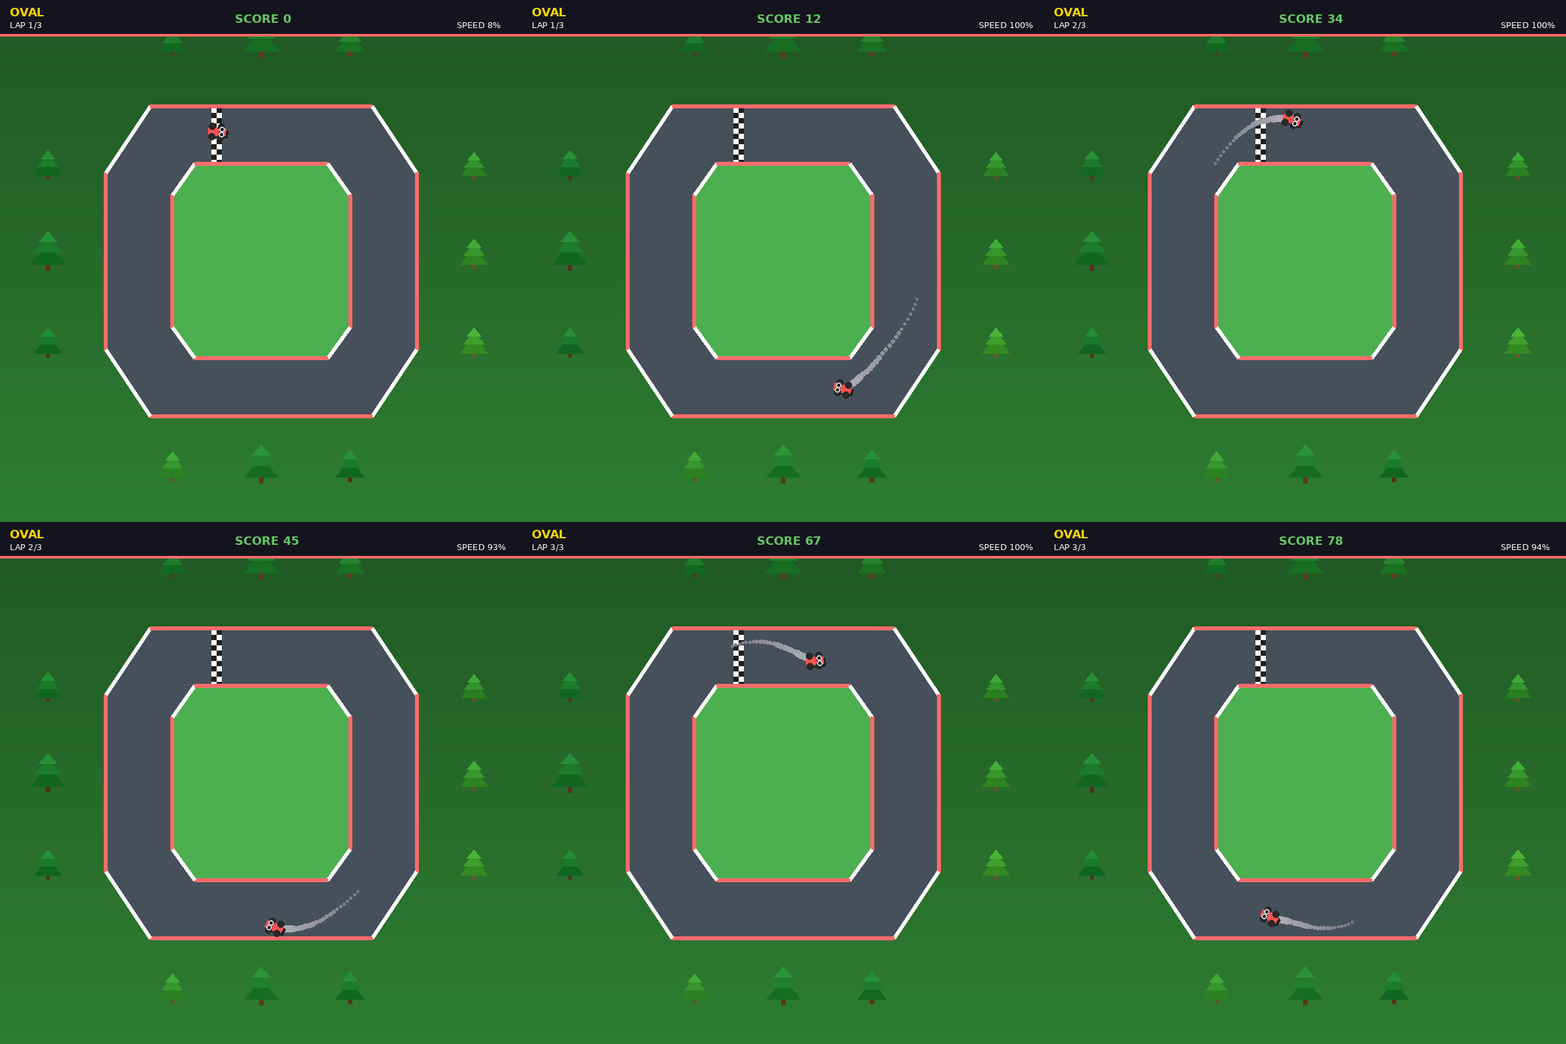
Our RL agent confidently navigating the training track.
For this post, we trained a simple reinforcement learning agent to drive around a simple oval track. We used Proximal Policy Optimization (PPO) with a simple MLP policy network, 3 million environment steps, reward shaping based on checkpoint gates. The agent observes its position, velocity, and distance to track boundaries. It outputs throttle and steering. (We'll save the deep dive on RL for a future post. This one's about what happens after training.)
After training, it's able to confidently navigate the track, going as fast as it can throughout and holding a fairly decent racing line. It's able to complete 3 laps without incident. The loss curves converged and the eval metrics (cumulative episode reward) plateaued. By every measure, this model is ready for deployment.
Time to ship it. What could possibly go wrong?
The Silent Failure
Same weights. Same architecture. Same inference code. We changed one thing: the track is 20% narrower.
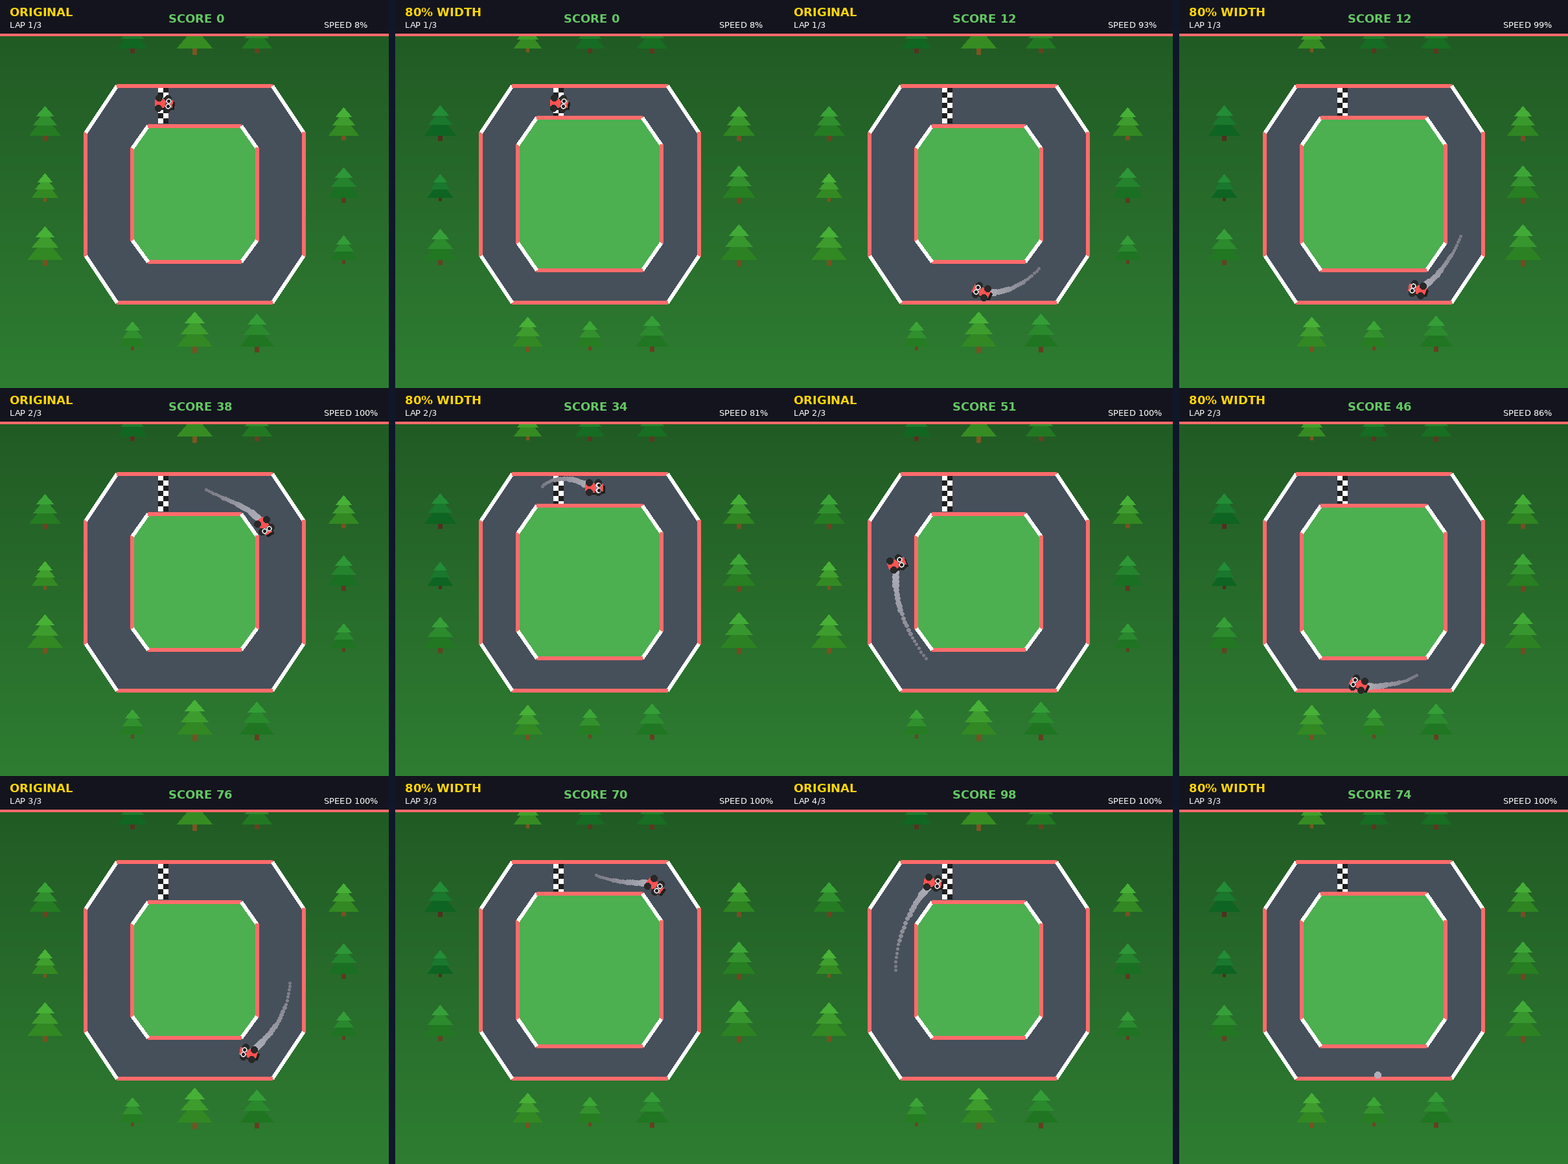
Left: training track. Right: 20% narrower track. Same model, different outcomes.
On the left, our agent glides around its training track, smooth and confident, fast and furious, living its life a quarter mile at a time. On the right, the same agent on the narrower track. It evidently struggles through the corners, the racing line it learned is now dangerously close to the wall and it's oversteering where it used to flow.
No exceptions were thrown. No error logs. The model didn't refuse to run or return NaN. It just got worse, silently. Without watching the lap times (or in this case, the GIF), you'd never know.
This is distribution drift, and it's the silent killer of production ML systems.
What Just Happened?
During training, our policy network learned a mapping from observations to actions that maximised cumulative reward on the training track. The neural network encoded implicit assumptions about the environment: corner radii, track width, safe distances from boundaries. These assumptions are baked into the weights.
When we narrowed the track by 20%, we violated those assumptions. The observations the agent now receives are out of distribution, falling outside the manifold of states it encountered during training. The policy still outputs actions, but they're extrapolations into territory the network has never seen.
It doesn't matter that the track looks almost identical. It doesn't matter that the physics engine is the same. The input distribution shifted, and unlike a human driver who'd notice the tighter margins and adapt, the model just keeps doing what it learned. It doesn't know what it doesn't know.
This is exactly what can happen to ML models in production.
The Types of Drift
Before we go further, let's clarify the terminology. Not all drift is created equal.
Data drift (covariate shift): The distribution of inputs changes while the relationship between inputs and outputs stays the same. In our toy demo, this is exactly what happened: the physics and reward function stayed constant, but the track dimensions shifted. The relationship between "what I see" and "what I should do" hasn't changed; the model just sees things it's never seen before. Real-world examples: user demographics shift over time, sensor calibration degrades, seasonal patterns rotate.
Concept drift: The relationship itself changes, meaning the correct output for a given input shifts. If we secretly changed the reward function to penalise right turns, the optimal policy would change even though the track looks identical. The model's observations haven't changed, but what it should do has.
Tokyo drift: When the racing line is perpendicular to the road and somehow that's optimal.
All are dangerous. Only one is cool.
RL Makes This Obvious, But Usually it Isn't
We chose reinforcement learning for this demonstration because the feedback loop is tight and the failure mode is visible. When an RL racing agent degrades, you can watch it happen in real-time: the car drifts wide, clips a wall, loses time. There's no hiding behind aggregate metrics.
Most production ML systems aren't this transparent. Drift happens in the dark:
- A recommendation engine starts surfacing less relevant content. Click-through rates drop 2% over three months. Nobody connects it to the input distribution shifting.
- A fraud detection model slowly lets more bad transactions through. By the time the chargeback data catches up, the losses have compounded beyond recovery.
- A demand forecasting system systematically under-predicts. Inventory runs out. Customers leave. The model never threw an error.
In these systems, there's no wall to hit. No visible crash. Just a slow, silent degradation that compounds until someone finally asks why the numbers don't look right anymore.
Our car hits walls. Your models hit revenue.
Detecting Drift
You can't course-correct if you don't know you're off-line. Here are the telemetry systems that can be used to keep your models on track:
Statistical distance metrics. Kolmogorov-Smirnov tests compare empirical CDFs between your training and production distributions. Population Stability Index (PSI) bins your features and measures divergence. KL divergence quantifies information loss when approximating one distribution with another. Set thresholds, alert when crossed.
Embedding drift. For high-dimensional inputs like text or images, raw feature comparisons are meaningless. Instead, monitor the distribution of learned embeddings from an encoder network. Track centroid movement, inter-cluster distances, or the distribution of cosine similarities to reference points. When embeddings start clustering differently, the inputs are changing even if they look the same to humans.
Performance monitoring. The most direct signal, but often the most delayed. Track precision, recall, calibration error, and business metrics against ground truth as it becomes available. A slow decline over weeks is classic drift. The challenge is that by the time you see it, the damage is done.
Shadow models. Run a recently-trained challenger model alongside your production champion. Log their predictions without serving the challenger. When disagreement rates spike, one of them is seeing something the other wasn't trained on. This is your early warning system.
Windowed retraining. Don't wait for drift to become a problem. Continuously retrain on rolling windows of fresh data, with proper validation gates to catch regressions before promotion. The goal is staying ahead of the curve, not reacting to it.
The hard part isn't knowing these techniques exist; it's implementing them properly, tuning the thresholds, and integrating them into production systems without introducing more complexity than they solve.
We Can Help
KH Solve can build this for you. Drift detection, model monitoring, automated retraining, whatever your system needs. Get in touch.
References
- Schulman, J., Wolski, F., Dhariwal, P., Radford, A., & Klimov, O. (2017). Proximal Policy Optimization Algorithms. arXiv:1707.06347. arXiv